Verify navigation with diagnostics
Use diagnostics to verify the facts your integration reports, the poses it applies and the corrections it sends. Camera movement alone can hide incorrect picks or bounds because it also reflects the server’s navigation policy.
This walkthrough follows logging and overlays in the runnable demo applications. Complete that quickstart first so your demo is running and connected to Rotatrix. The examples below show how the integration collects evidence and how the application displays it.
Native integrations can configure local session logs once to capture SDK events and host messages with automatic rotation and retention. Browser demos use the same logging interface with a console sink.
Try diagnostics in the demo
Section titled “Try diagnostics in the demo”- Run the demo with Rotatrix connected, then press D to show diagnostics.
- Start a gesture over a cube. Compare the reported pick point and bounds with the cube, then repeat over empty space and with a selection. Check which query alternatives were actually evaluated.
- Use mouse navigation during the gesture to see correction status. Press D again to hide the overlay; logging continues in the terminal or browser console.
Normal logs include query results, gesture changes, corrections and readback status changes. Gesture performance summaries are collected automatically; see performance summary fields. To include correction details, enable debug logging:
python examples/python_demo_3d_app/main.py --debugdotnet run --project examples/csharp_demo_3d_app/OpenAxisDemo.csproj -- --debugSet the second argument to true when creating MyOpenAxisIntegration in the
demo’s entry point, then reload the page. Messages appear in the browser console.
For the Windows Release build from the quickstart:
cpp/build/demo/Release/openaxis_demo.exe --debugUnderstand the results
Section titled “Understand the results”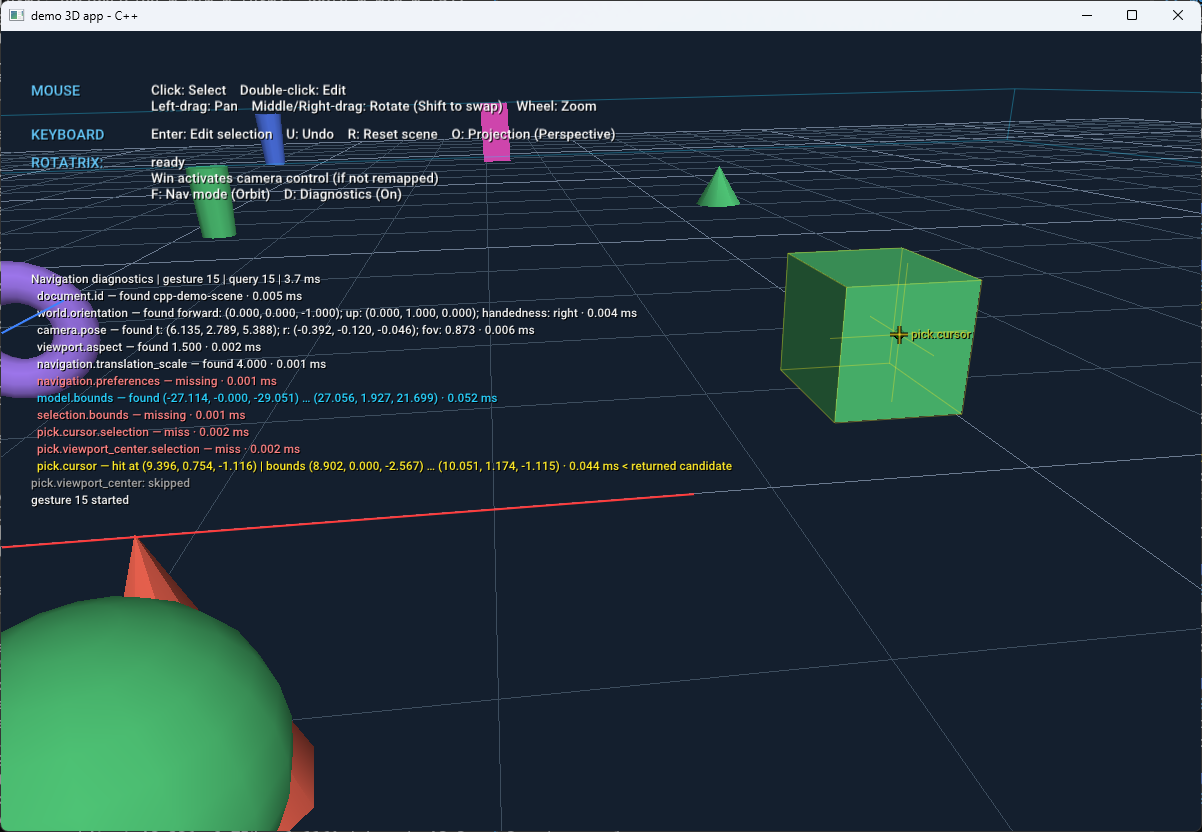
In this capture, the yellow pick.cursor row reports a hit and identifies it as
the returned candidate. The 2D crosshair marks the screen position picked;
the 3D crosshair marks the resulting surface position.
The selection-only picks missed, while pick.viewport_center was skipped after
an earlier candidate supplied a result. The header identifies the gesture and
query, and the timings show how long the query and individual facts took.
“Returned candidate” confirms what the client sent, not which pivot the server
ultimately chose.
| Result | Meaning |
|---|---|
| Unknown readback | The write succeeded, but the application did not return its resulting pose. |
| Equivalent / differs | The resulting pose matches / differs under the NavigationSession’s comparison policy. Application constraints can legitimately change a pose. |
| Acknowledged | The server acknowledged a delta correction sent by the integration. |
| Skipped | An earlier alternative supplied the query result, so this alternative was not evaluated. |
| Returned candidate | The first available result returned to the server. The client does not know whether the server ultimately used it. |
The collector uses actual query and write results, without extra picks or camera reads. Retained correction status expires according to the collector configuration.
How diagnostic evidence flows
Section titled “How diagnostic evidence flows”Three components connect navigation to the display:
- The SDK’s
NavigationSessionexecutes queries and pose updates through the application’s adapter, then reports their results. - The SDK’s
NavigationDiagnosticscollector turns those results into log messages and a presentation snapshot containing text and geometry. - The application’s logger and renderer send messages to the console and draw the snapshot in the viewport.
The integration creates and connects these components. Its pick resolver also returns a local marker position, so the collector can show where each test ran.
Collector setup
Section titled “Collector setup”At startup, the integration creates the collector and supplies it to
NavigationSession. That connects the collector to actual navigation results
and the same comparison policy used to detect camera or object changes.
MyOpenAxisIntegration.start() extends the quickstart’s setup here. app,
client, adapter and scheduler are already created. Passing the collector
to the NavigationSession lets it observe real navigation; the application hooks provide
the toggle and rendering callbacks:
configure_logging("python-demo", level="debug" if logging.getLogger().isEnabledFor(logging.DEBUG) else "info", sinks=[lambda level, message: getattr(logging.getLogger("demo"), level)(message)])diagnostics = NavigationDiagnostics(log_level="debug", context_key=lambda context: app)object_adapter = MyObjectAdapter(app)session = NavigationSession(client, adapter, scheduler, observation=adapter.read, diagnostics=diagnostics, object_adapter=object_adapter, object_observation=object_adapter.read, comparison=compare_camera_pose, object_comparison=compare_object_pose)app.toggle_diagnostics = lambda: diagnostics.set_enabled(not diagnostics.enabled)app.diagnostic_frame = lambda: diagnostics.presentation()app.diagnostics_enabled = lambda: diagnostics.enabledapp.diagnostic_colors = COLORSView full implementation: MyOpenAxisIntegration.start →
The SDK writes a session file and mirrors messages through Python’s logging
module, configured for INFO or DEBUG with --debug. The application hooks connect D to capture visibility and
provide the renderer with presentation data and the shared palette.
The MyOpenAxisIntegration constructor passes its collector to the NavigationSession built
from the existing client, camera adapter, object adapter objects and scheduler:
var fileLog = DiagnosticLog.Configure("csharp-demo");fileLog.DebugLogging = debug;fileLog.Message += (level, message) => Console.WriteLine($"{level}: {message}");diagnostics = new NavigationDiagnostics(contextKey: _ => app) { DebugLogging = debug };session = new NavigationSession(client, adapter, scheduler, observation: adapter.Read, objectAdapter: objects, objectObservation: objects.Read, diagnostics: diagnostics);The MyOpenAxisIntegration constructor configures a session file with a console mirror. DebugLogging follows --debug. Its UI hook toggles capture without disabling logging:
app.ToggleDiagnostics = () => { diagnostics.SetEnabled(!diagnostics.Enabled); RefreshDiagnostics(null, EventArgs.Empty); };View full implementation: MyOpenAxisIntegration.MyOpenAxisIntegration →
The MyOpenAxisIntegration constructor receives the application and creates its
client before this excerpt. The configured SDK logger formats messages for the browser
console, and contextKey associates camera and object evidence with the same viewport:
configureLogging("typescript-demo");this.diagnostics = new NavigationDiagnostics({ enabled: false, logLevel: debug ? "debug" : "info", // Object contexts and camera contexts belong to this one viewport. contextKey: () => app,});const objects = new MyObjectAdapter(app);this.session = new NavigationSession( this.client, new MyNavigationAdapter(app), { observation: (context) => structuredClone(context.readCamera()), objectAdapter: objects, objectObservation: (edit) => objects.read(edit), diagnostics: this.diagnostics, },);View full implementation: MyOpenAxisIntegration.constructor →
The demo’s MyOpenAxisIntegration constructor initializes the collector before the session
so it remains alive for the session’s lifetime. This excerpt from its initializer
list connects the collector to the demo log and session; client and scheduler
are earlier members:
collector([debug] { DiagnosticOptions options; options.debug = debug; auto log = DiagnosticLog::configure("cpp-demo"); log->debug = debug; log->sink = [](const std::string &level, const std::string &message) { std::clog << level << ": " << message << std::endl; }; return options;}()), connection(client, {[this] { return metadata; }}) { NavigationOptions options; options.scheduler = &scheduler; options.object_adapter = &objects; options.observation = [this](const NavigationContext &context) { return adapter.read_camera(context); }; options.object_observation = [this](const NavigationContext &context) { return objects.read_object(context); }; options.on_event = [this](const NavigationEvent &event) { if (event.event == "query_context") { const auto &context = std::any_cast<const MyNavigationContext &>(event.context); // Bind evidence before the query completes, using its captured generation. collector.set_context("reference/" + std::to_string(context.generation)); } }; // Offline smoke tests inject messages without a server. if (offline) session = std::make_unique<NavigationSession>(adapter, [](const Value &) { return true; }, &collector, options); else session = std::make_unique<NavigationSession>(client, adapter, &collector, options);Picker evidence
Section titled “Picker evidence”A pick crosshair shows where the application tested the scene, including tests
that missed. When NavigationSession requests a pick fact, the demo’s resolver
calls the application’s picker and returns markerPosition alongside the hit
point and bounds. A miss returns only the marker position. A skipped test, such
as a selection pick with no selection, returns the unavailable value.
The collector reads that position from the resolver result. The SDK removes it
before choosing an available candidate and sending the response, so a miss still
allows the next first alternative to run.
MyQueryCapture.resolve() chooses the saved cursor or viewport center and checks
that a test can run. app is the application captured for this query:
pixel = self.cursor if name.startswith('pick.cursor') else (self.width/2, self.height/2)if (pixel is None or not (0 <= pixel[0] < self.width and 0 <= pixel[1] < self.height) or (name.endswith('.selection') and self.app.selected is None)): return UNAVAILABLEhit = self.app.pick(pixel, selection_only=name.endswith('.selection'))if hit is not None: _, point, box = hit return {'point': point, 'bounds': bounds_value((box.minimum, box.maximum)), 'markerPosition': pixel}return {'markerPosition': pixel}MyQueryCapture.Resolve() uses the captured viewport size and cursor. After a
test, it returns the same screen point for the overlay to display:
Point? pixel = name.StartsWith("pick.cursor") ? cursor : new Point(width / 2, height / 2);if (pixel is Point point && point.X >= 0 && point.X < width && point.Y >= 0 && point.Y < height && (!name.EndsWith(".selection") || app.Selected >= 0)){ var hit = app.Pick(point, name.EndsWith(".selection")); if (hit != null) return new Dictionary<string, object> { ["markerPosition"] = new[] { point.X, point.Y }, ["point"] = Values.Vector(hit.Position), ["bounds"] = Values.Bounds(hit.Bounds) }; return new Dictionary<string, object> { ["markerPosition"] = new[] { point.X, point.Y } };}MyQueryCapture.resolve() passes the query’s sample position to MyApplication.pick().
The picker supplies sample.ray whenever a test ran, including a miss; it returns
an empty sample when the test was skipped:
const pixel: [number, number] | undefined = name.startsWith("pick.cursor") ? this.cursor : [this.width / 2, this.height / 2];if (!pixel) return UNAVAILABLE;const sample = this.app.pick(pixel, name.endsWith(".selection"));return sample.ray ? { ...sample.hit, markerPosition: pixel } : UNAVAILABLE;The demo’s MyQueryCapture::resolve derives x and y from the requested cursor or
center sample. only indicates a selection-only test. After validating those
inputs, it returns the pick and local marker coordinates:
auto hit = app.pick(x, y, only);if (hit) { Value v = {{"point", vector_value(hit->point)}, {"markerPosition", {x, y}}}; v["bounds"] = hit->object >= 0 ? app.bounds(hit->object).value() : app.ground_bounds().value(); return v;}return Value{{"markerPosition", {x, y}}};The demo renderers interpret markerPosition in their own viewport coordinates.
This local position is distinct from the protocol’s cursor coordinates; other
applications can use a different convention, such as NDC. Samples at identical
positions with the same tone share a crosshair with separate label lines. The
pick evidence reference describes
the return contract.
Application display
Section titled “Application display”A presentation snapshot contains text rows, world-space segments and screen markers. Its context identifies the view that produced the evidence; its expiry deadline tells the application when retained status needs refreshing. This lets the renderer display the collected results without re-running queries.
The application reads the snapshot on the collector’s owning thread, draws it in the matching view, and refreshes after expiry even if no new event arrives.
Panda3D’s frame callback calls MyApplication._draw_diagnostics(). It checks context, revision,
expiry and viewport size before rebuilding:
def _draw_diagnostics(self): # Only the renderer is application code; content/styles come from SDK. frame = self.diagnostic_frame() if frame is None: for node in self._diagnostic_nodes: node.remove_node() self._diagnostic_nodes.clear() self._diagnostic_world_points = () self._diagnostic_key = None return key = (frame.revision,frame.expires_at,self.size) if key == self._diagnostic_key: return self._diagnostic_key = key for node in self._diagnostic_nodes: node.remove_node() self._diagnostic_nodes.clear() self._diagnostic_world_points = () if frame.context is not None and frame.context is not self: return self._diagnostic_world_points = tuple( point for segment in frame.segments for point in (segment.start,segment.end))View full implementation: MyApplication._draw_diagnostics →
The renderer uses the presentation’s text, tones, segments and markers. Its drawing implementation is available in the full source.
The raylib demo renders SDK text rows, colored world segments and screen markers in
an overlay. The integration registers RefreshDiagnostics with the application’s frame
event at startup. That callback checks for changed or expired presentation data:
void RefreshDiagnostics(object? sender, EventArgs args){ var frame = diagnostics.Presentation(); var key = (frame.Revision, frame.ExpiresAt, diagnostics.Enabled); if (diagnosticKey == key) return; diagnosticKey = key; app.SetDiagnostics(frame, diagnostics.Enabled);}View full implementation: MyOpenAxisIntegration.RefreshDiagnostics →
MyApplication.DrawDiagnostics() maps tones through DiagnosticPalette.Color,
projects segments using the current camera and draws markers in raylib’s screen coordinates.
The overlay is excluded from scene bounds and picking. StopAsync detaches the
render callback and clears the display before the native window closes.
At startup, the demo calls the integration’s showDiagnostics helper with its
viewport, camera accessor and context check. The helper starts an animation-frame
loop and returns a cleanup function that the demo calls at shutdown:
export function showDiagnostics( integration: MyOpenAxisIntegration, output: HTMLElement, viewport: HTMLCanvasElement, camera: () => Camera, isCurrent: (context: unknown) => boolean,): () => void { const overlay = new NavigationDiagnosticOverlay( viewport, output, DIAGNOSTIC_COLORS, ); overlay.screenCoordinates = "pixels"; let frame: number; const draw = () => { overlay.draw(integration.diagnostics, camera(), isCurrent); frame = requestAnimationFrame(draw); }; draw(); return () => { cancelAnimationFrame(frame); overlay.dispose(); };}View full implementation: showDiagnostics →
NavigationDiagnosticOverlay is demo code. On each frame it reads the SDK
presentation, checks its context and expiry, and draws text, world segments and
viewport-pixel markers using DIAGNOSTIC_COLORS.
The GLFW loop reads collector.presentation() when redrawing. The demo’s
render_navigation_overlay clips world segments to the current camera frustum,
projects them and draws labeled crosshairs. After drawing, the loop waits for an
input event, scheduled work or the presentation’s expiry deadline, whichever
comes first.
Adapt it to your application
Section titled “Adapt it to your application”Use the Diagnostics API for evidence fields, context mapping, thread ownership and refresh scheduling. Follow the rendering contract when mapping that evidence to native graphics. Use local session logs to route output, or observer events for a custom consumer.
Verify each supported input
Section titled “Verify each supported input”Check reported facts against known application state before judging navigation. Cover each supported fact, including unavailable cases:
- Picking: cursor and viewport-center samples, with and without a selection; hits, misses and a cursor outside the viewport.
- Geometry and camera: bounds, orientation and camera pose in both projection types, with wide and tall viewports.
- Pose application: requested versus observed poses, including constraints and concurrent native input; verify the resulting corrections.
- Context: switch documents, views and object targets; evidence must remain associated with the context that produced it.
A skipped alternative has not been tested: exercise a query that requests it or test the resolver directly. Do not count a plausible server-chosen pivot as verification of all pick alternatives. Compare diagnostics enabled and disabled: camera behavior and query results should match. Check expiry and shutdown cleanup. If you add a graphical overlay, verify its markers, bounds and context filtering too.